

















책 이미지

eBook 미리보기
책 정보
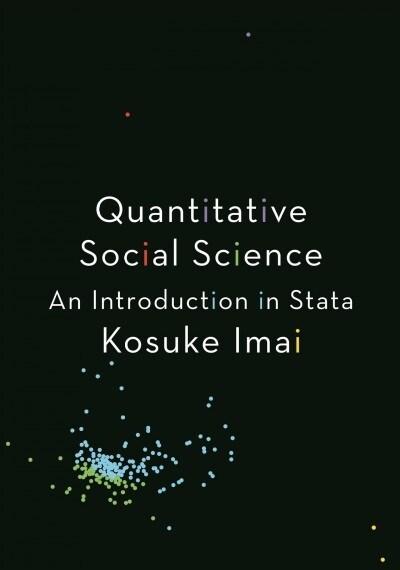
· 제목 : Quantitative Social Science: An Introduction in Stata (Paperback)
· 분류 : 외국도서 > 인문/사회 > 사회과학 > 리서치
· ISBN : 9780691191096
· 쪽수 : 472쪽
· 출판일 : 2021-03-16
· 분류 : 외국도서 > 인문/사회 > 사회과학 > 리서치
· ISBN : 9780691191096
· 쪽수 : 472쪽
· 출판일 : 2021-03-16
목차
- List of Tables
- List of Figures
- Preface
- Preface to the Original Book
- 1 INTRODUCTION
- 1.1 Overview of the Book
- 1.2 How to Use this Book
- 1.3 Introduction to Stata
- 1.3.1 Arithmetic Operations
- 1.3.2 Variables
- 1.3.3 Labels
- 1.3.4 Describing the Data
- 1.3.5 Data Files
- 1.3.6 Merging Data Sets in Stata
- 1.3.7 Packages
- 1.3.8 Programming and Learning Tips
- 1.4 Summary
- 1.5 Exercises
- 1.5.1 Bias in Self-Reported Turnout
- 1.5.2 Understanding World Population Dynamics
- 2 CAUSALITY
- 2.1 Racial Discrimination in the Labor Market
- 2.2 Subsetting the Data in Stata
- 2.2.1 Relational Operators
- 2.2.2 Logical Operators
- 2.2.3 Simple Conditional Statements and Variable Creation
- 2.2.4 Subsetting Using Conditions
- 2.2.5 Preserving and Transforming Data Sets
- 2.3 Causal Effects and the Counterfactual
- 2.4 Randomized Controlled Trials
- 2.4.1 The Role of Randomization
- 2.4.2 Social Pressure and Voter Turnout
- 2.5 Observational Studies
- 2.5.1 Minimum Wage and Unemployment
- 2.5.2 Confounding Bias
- 2.5.3 Before-and-After and Difference-in-Differences Designs
- 2.6 Descriptive Statistics for a Single Variable
- 2.6.1 Quantiles
- 2.6.2 Standard Deviation
- 2.7 Summary
- 2.8 Exercises
- 2.8.1 Efficacy of Small Class Size in Early Education
- 2.8.2 Changing Minds on Gay Marriage
- 2.8.3 Success of Leader Assassination as a Natural Experiment
- 3 MEASUREMENT
- 3.1 Measuring Civilian Victimization during Wartime
- 3.2 Handling Missing Data in Stata
- 3.2.1 Missings Package
- 3.3 Visualizing the Univariate Distribution
- 3.3.1 Bar Plot
- 3.3.2 Histogram
- 3.3.3 Box Plot
- 3.3.4 Printing and Saving Graphs
- 3.4 Survey Sampling
- 3.4.1 The Role of Randomization
- 3.4.2 Nonresponse and Other Sources of Bias
- 3.5 Measuring Political Polarization
- 3.6 Summarizing Bivariate Relationships
- 3.6.1 Scatterplot
- 3.6.2 Correlation
- 3.6.3 Quantile–Quantile Plot
- 3.7 Clustering
- 3.7.1 The k-Means Algorithm
- 3.8 Summary
- 3.9 Exercises
- 3.9.1 Changing Minds on Gay Marriage: Revisited
- 3.9.2 Political Efficacy in China and Mexico
- 3.9.3 Voting in the United Nations General Assembly
- 4 PREDICTION
- 4.1 Predicting Election Outcomes
- 4.1.1 Macros
- 4.1.2 Loops
- 4.1.3 Poll Predictions
- 4.2 Linear Regression
- 4.2.1 Facial Appearance and Election Outcomes
- 4.2.2 Correlation and Scatterplots
- 4.2.3 Least Squares
- 4.2.4 Regression toward the Mean
- 4.2.5 Model Fit
- 4.3 Regression and Causation
- 4.3.1 Randomized Experiments
- 4.3.2 Regression with Multiple Predictors
- 4.3.3 Heterogeneous Treatment Effects
- 4.3.4 Regression Discontinuity Design
- 4.4 Summary
- 4.5 Exercises
- 4.5.1 Prediction Based on Betting Markets
- 4.5.2 Election and Conditional Cash Transfer Program in Mexico
- 4.5.3 Government Transfer and Poverty Reduction in Brazil
- 4.1 Predicting Election Outcomes
- 5 PROBABILITY
- 5.1 Probability
- 5.1.1 Frequentist versus Bayesian
- 5.1.2 Definition and Axioms
- 5.1.3 Permutations
- 5.1.4 Sampling with and without Replacement
- 5.1.5 Combinations
- 5.2 Conditional Probability
- 5.2.1 Conditional, Marginal, and Joint Probabilities
- 5.2.2 Independence
- 5.2.3 Bayes’ Rule
- 5.2.4 Predicting Race Using Surname and Residence Location
- 5.3 Random Variables and Probability Distributions
- 5.3.1 Random Variables
- 5.3.2 Bernoulli and Uniform Distributions
- 5.3.3 Binomial Distribution
- 5.3.4 Normal Distribution
- 5.3.5 Expectation and Variance
- 5.3.6 Predicting Election Outcomes with Uncertainty
- 5.4 Large Sample Theorems
- 5.4.1 The Law of Large Numbers
- 5.4.2 The Central Limit Theorem
- 5.5 Summary
- 5.6 Exercises
- 5.6.1 The Mathematics of Enigma
- 5.6.2 A Probability Model for Betting Market Election Prediction
- 5.1 Probability
- 6 UNCERTAINTY
- 6.1 Estimation
- 6.1.1 Unbiasedness and Consistency
- 6.1.2 Standard Error
- 6.1.3 Confidence Intervals
- 6.1.4 Margin of Error and Sample Size Calculation in Polls
- 6.1.5 Analysis of Randomized Controlled Trials
- 6.1.6 Analysis Based on Student’s t-Distribution
- 6.2 Hypothesis Testing
- 6.2.1 Tea-Tasting Experiment
- 6.2.2 The General Framework
- 6.2.3 One-Sample Tests
- 6.2.4 Two-Sample Tests
- 6.2.5 Pitfalls of Hypothesis Testing
- 6.2.6 Power Analysis
- 6.3 Linear Regression Model with Uncertainty
- 6.3.1 Linear Regression as a Generative Model
- 6.3.2 Unbiasedness of Estimated Coefficients
- 6.3.3 Standard Errors of Estimated Coefficients
- 6.3.4 Inference about Coefficients
- 6.3.5 Inference about Predictions
- 6.4 Summary
- 6.5 Exercises
- 6.5.1 Sex Ratio and the Price of Agricultural Crops in China
- 6.5.2 Filedrawer and Publication Bias in Academic Research
- 6.5.3 The 1932 German Election in the Weimar Republic
- 6.1 Estimation
- 7 DISCOVERY
- 7.1 Network Data
- 7.1.1 Marriage Network in Renaissance Florence
- 7.1.2 Undirected Graph and Centrality Measures
- 7.1.3 Twitter Following Network
- 7.1.4 Directed Graph and Centrality
- 7.2 Spatial Data
- 7.2.1 The 1854 Cholera Outbreak in London
- 7.2.2 Spatial Data in Stata
- 7.2.3 United States Presidential Elections
- 7.2.4 Expansion of Walmart
- 7.2.5 Animation in Stata
- 7.3 Textual Data
- 7.3.1 The Disputed Authorship of The Federalist Papers
- 7.3.2 Topic Discovery
- 7.3.3 Document–Term Matrix and Clusters
- 7.3.4 Authorship Prediction
- 7.3.5 Cross Validation
- 7.4 Summary
- 7.5 Exercises
- 7.5.1 International Trade Network
- 7.5.2 Mapping US Presidential Election Results over Time
- 7.5.3 Analyzing the Preambles of Constitutions
- 7.1 Network Data
- 8 NEXT
- General Index
- Stata Index
- Stata Command Abbreviation List