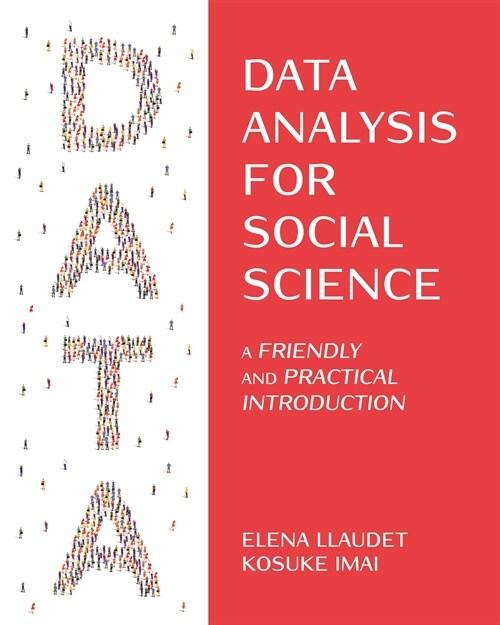


















책 이미지

eBook 미리보기
책 정보
· 제목 : Data Analysis for Social Science: A Friendly and Practical Introduction (Paperback)
· 분류 : 외국도서 > 인문/사회 > 사회과학 > 통계
· ISBN : 9780691199436
· 쪽수 : 256쪽
· 출판일 : 2022-11-29
· 분류 : 외국도서 > 인문/사회 > 사회과학 > 통계
· ISBN : 9780691199436
· 쪽수 : 256쪽
· 출판일 : 2022-11-29
목차
- Preface
- 1 Introduction
- 1.1 Book Overview
- 1.2 Chapter Summaries
- 1.3 How to Use This Book
- 1.4 Why Learn to Analyze Data?
- 1.4.1 Learning to Code
- 1.5 Getting Ready
- 1.6 Introduction to R
- 1.6.1 Doing Calculations in R
- 1.6.2 Creating Objects in R
- 1.6.3 Using Functions in R
- 1.7 Loading and Making Sense of Data
- 1.7.1 Setting the Working Directory
- 1.7.2 Loading the Dataset
- 1.7.3 Understanding the Data
- 1.7.4 Identifying the Types of Variables Included
- 1.7.5 Identifying the Number of Observations
- 1.8 Computing and Interpreting Means
- 1.8.1 Accessing Variables inside Dataframes
- 1.8.2 Means
- 1.9 Summary
- 1.10 Cheatsheets
- 1.10.1 Concepts and Notation
- 1.10.2 R Symbols and Operators
- 1.10.3 R Functions
- 2 Estimating Causal Effects with Randomized Experiments
- 2.1 Project STAR
- 2.2 Treatment and Outcome Variables
- 2.2.1 Treatment Variables
- 2.2.2 Outcome Variables
- 2.3 Individual Causal Effects
- 2.4 Average Causal Effects
- 2.4.1 Randomized Experiments and the Difference-in-Means Estimator
- 2.5 Do Small Classes Improve Student Performance?
- 2.5.1 Relational Operators in R
- 2.5.2 Creating New Variables
- 2.5.3 Subsetting Variables
- 2.6 Summary
- 2.7 Cheatsheets
- 2.7.1 Concepts and Notation
- 2.7.2 R Symbols and Operators
- 2.7.3 R Functions
- 3 Inferring Population Characteristics via Survey Research
- 3.1 The EU Referendum in the UK
- 3.2 Survey Research
- 3.2.1 Random Sampling
- 3.2.2 Potential Challenges
- 3.3 Measuring Support for Brexit
- 3.3.1 Predicting the Referendum Outcome
- 3.3.2 Frequency Tables
- 3.3.3 Tables of Proportions
- 3.4 Who Supported Brexit?
- 3.4.1 Handling Missing Data
- 3.4.2 Two-Way Frequency Tables
- 3.4.3 Two-Way Tables of Proportions
- 3.4.4 Histograms
- 3.4.5 Density Histograms
- 3.4.6 Descriptive Statistics
- 3.5 Relationship between Education and the LeaveVote in the Entire UK
- 3.5.1 Scatter Plots
- 3.5.2 Correlation
- 3.6 Summary
- 3.7 Cheatsheets
- 3.7.1 Concepts and Notation
- 3.7.2 R Symbols and Operators
- 3.7.3 R Functions
- 4 Predicting Outcomes Using Linear Regression
- 4.1 GDP and Night-Time Light Emissions
- 4.2 Predictors, Observed vs. Predicted Outcomes, andPrediction Errors
- 4.3 Summarizing the Relationship between Two Variables with a Line
- 4.3.1 The Linear Regression Model
- 4.3.2 The Intercept Coefficient
- 4.3.3 The Slope Coefficient
- 4.3.4 The Least Squares Method
- 4.4 Predicting GDP Using Prior GDP
- 4.4.1 Relationship between GDP and Prior GDP
- 4.4.2 With Natural Logarithm Transformations
- 4.5 Predicting GDP Growth Using Night-Time LightEmissions
- 4.6 Measuring How Well the Model Fits the Data with the Coefficient of Determination, R2
- 4.6.1 How Well Do the Three Predictive Modelsin This Chapter Fit the Data?
- 4.7 Summary
- 4.8 Appendix: Interpretation of the Slope in the Log-Log Linear Model
- 4.9 Cheatsheets
- 4.9.1 Concepts and Notation
- 4.9.2 R Functions
- 5 Estimating Causal Effects with Observational Data
- 5.1 Russian State-Controlled TV Coverage of 2014Ukrainian Affairs
- 5.2 Challenges of Estimating Causal Effects withObservational Data
- 5.2.1 Confounding Variables
- 5.2.2 Why Are Confounders a Problem?
- 5.2.3 Confounders in Randomized Experiments
- 5.3 The Effect of Russian TV on Ukrainians’ VotingBehavior
- 5.3.1 Using the Simple Linear Model to Computethe Difference-in-Means Estimator
- 5.3.2 Controlling for Confounders Using aMultiple Linear Regression Model
- 5.4 The Effect of Russian TV on Ukrainian ElectoralOutcomes
- 5.4.1 Using the Simple Linear Model to Computethe Difference-in-Means Estimator
- 5.4.2 Controlling for Confounders Using aMultiple Linear Regression Model
- 5.5 Internal and External Validity
- 5.5.1 Randomized Experiments vs.Observational Studies
- 5.5.2 The Role of Randomization
- 5.5.3 How Good Are the Two Causal Analysesin This Chapter?
- 5.5.4 How Good Was the Causal Analysis inChapter 2?
- 5.5.5 The Coefficient of Determination, R2
- 5.6 Summary
- 5.7 Cheatsheets
- 5.7.1 Concepts and Notation
- 5.7.2 R Functions
- 6 Probability
- 6.1 What Is Probability?
- 6.2 Axioms of Probability
- 6.3 Events, Random Variables, and ProbabilityDistributions
- 6.4 Probability Distributions
- 6.4.1 The Bernoulli Distribution
- 6.4.2 The Normal Distribution
- 6.4.3 The Standard Normal Distribution
- 6.4.4 Recap
- 6.5 Population Parameters vs. Sample Statistics
- 6.5.1 The Law of Large Numbers
- 6.5.2 The Central Limit Theorem
- 6.5.3 Sampling Distribution of the Sample Mean
- 6.6 Summary
- 6.7 Appendix: For Loops
- 6.8 Cheatsheets
- 6.8.1 Concepts and Notation
- 6.8.2 R Symbols and Operators
- 6.8.3 R Functions
- 7 Quantifying Uncertainty
- 7.1 Estimators and Their Sampling Distributions
- 7.2 Confidence Intervals
- 7.2.1 For the Sample Mean
- 7.2.2 For the Difference-in-Means Estimator
- 7.2.3 For Predicted Outcomes
- 7.3 Hypothesis Testing
- 7.3.1 With the Difference-in-Means Estimator
- 7.3.2 With Estimated Regression Coefficients
- 7.4 Statistical vs. Scientific Significance
- 7.5 Summary
- 7.6 Cheatsheets
- 7.6.1 Concepts and Notation
- 7.6.2 R Symbols and Operators
- 7.6.3 R Functions
- Index of Concepts
- Index of Mathematical Notation
- Index of R and RStudio